|
Hermes DRS
6.0
reduction software
|
|
Hermes DRS
6.0
reduction software
|
Public Member Functions | |
| def | __init__ |
| Make a Hermes component and initialize variables. | |
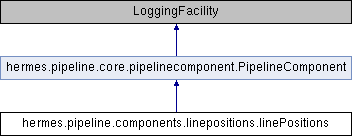
 Public Member Functions inherited from hermes.pipeline.core.pipelinecomponent.PipelineComponent Public Member Functions inherited from hermes.pipeline.core.pipelinecomponent.PipelineComponent | |
| def | __init__ |
| def | __call__ |
| def | optionsAreValid |
| def | getOptions |
| def | setOptions |
| def | checkExistShapeUnits |
| def | isOption |
Public Attributes | |
| stepShift | |
| set initial values | |
| isDebug | |
| isPlotNeeded | |
| isDifferential | |
| lineWidth | |
| maxShift | |
| minShift | |
| results | |
| Public Attributes inherited from hermes.pipeline.core.pipelinecomponent.PipelineComponent | |
| options | |
| logger | |
| ConsoleLogSeverity | |
| default value | |
| canShowGraphics | |
| when machine does not run matplotlib. More... | |
PURPOSE :


COMMENTS :


SYNTAX :


INPUT CONSTANTS FROM INSTRUMENT MODEL :


INPUT DATA FROM RESULTDICT :

    ImageWCFtemplate
        the WCF template
    extImageWCF
        the extracted WCF image
    tblAbsLinePos
        the table of line positions
        Is the list of spectral lines identified in each order
        format is per transition : order number, line center position in wavelength units
        line center position in pixel units, log(surface)

OPTIONS READ FROM OPTIONDICT :

MANDATORY :

OPTIONAL :

    isDifferential (boolean)
        default : True

    minShiftLinePositions (int)
        default : -3
        Smallest allowed shift value
    maxShiftLinePositions (int)
        default : +3
        Largest allowed shift value

    lastOrder (int)
        default : 95 (int)
        last Order on the CCD

    firstOrder (int)
        default : 40 (int)
        first Order on the CCD

    halfLineBaseWidth (int)
        default : 15
        In pixel units. It represents the half width of the line.

    isPlotNeeded (boolean)
        default : True
        If true, the module plots the measured equivalent width of the lines
        as a function of the expected value.


OUTPUT WRITTEN TO THE RESULTDICT:

Are always written :

    DiffLinePositions
        It contains the measured shift values and all the information contained in
        tblAbsLinePos. The format is:
            DiffLinePositions[per line in given order,0] = shift estimate
            DiffLinePositions[per line in given order,1] = log of the measured line surface
            DiffLinePositions[per line in given order,2] = maximum value of the correlation
            DiffLinePositions[per line in given order,3:DiffLinePositions.shape[1]] = tblAbsLinePos[per line in given order,:]

    MaskLinePositions
        In this vector, there is one entry per line in tblAbsLinePos.
        Each element is a boolean. True if the estimated shifted value can be trusted, False
        if it cannot be trusted (e.g. order edges, shifted too much ...)

    AbsoluteLinePositions
        It contains the measured shift values and all the information contained in
        tblAbsLinePos. The format is:
            AbsoluteLinePositions[per line in given order,0] = shift estimate + old position (= absolute line position)
            AbsoluteLinePositions[per line in given order,1] = log of the measured line surface
            AbsoluteLinePositions[per line in given order,2] = maximum value of the correlation
            AbsoluteLinePositions[per line in given order,3:AbsoluteLinePositions.shape[1]] = tblAbsLinePos[per line in given order,:]

When success condition is not met :


SUCCESS CONDITIONS :  1.8.6
1.8.6

